Overview
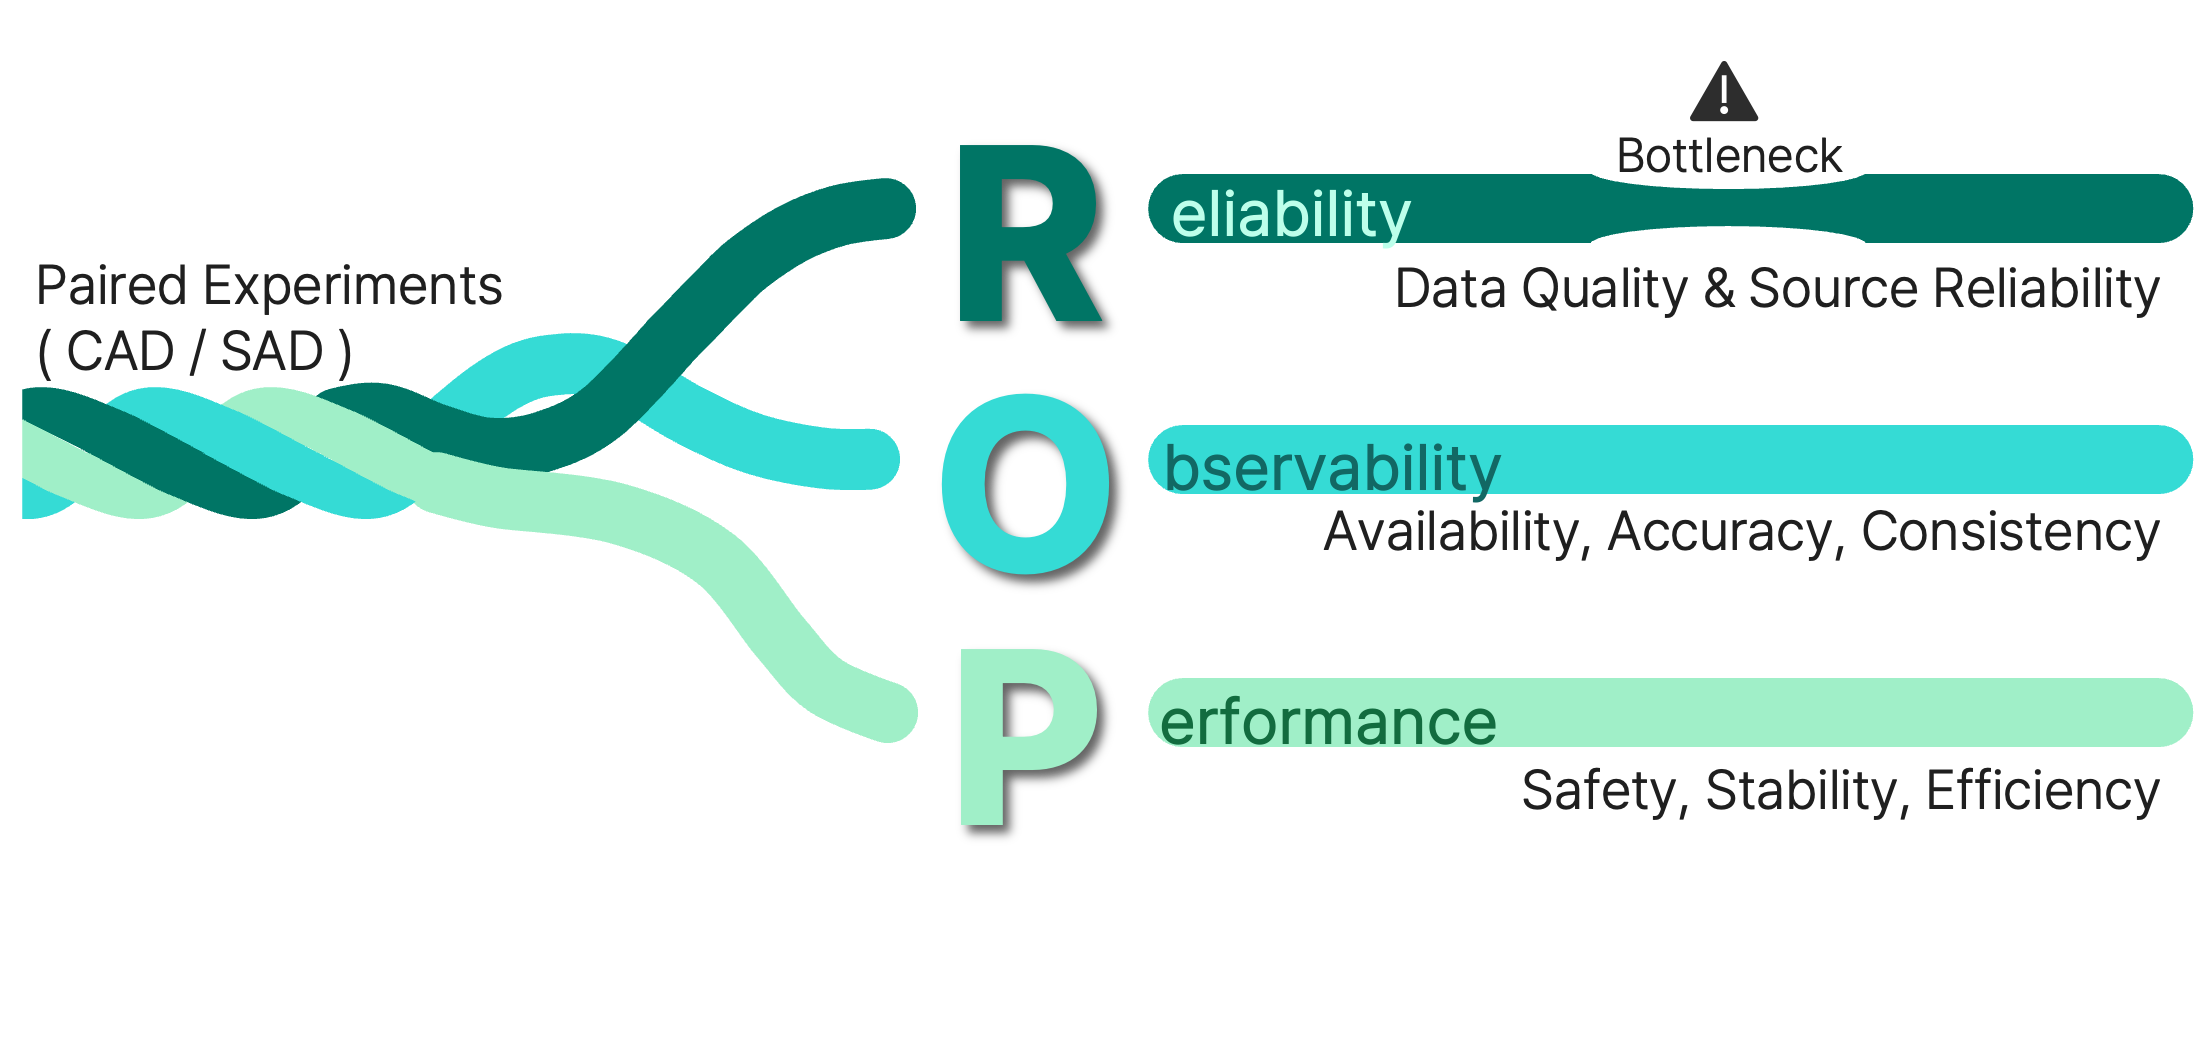
To quantify why and how much cooperative driving helps, designed a 3-axis framework (R: input reliability, O: perception state-estimation quality, P: driving performance) with an OST/ΔOST metric, validated cooperative vs non-cooperative (WC vs WOC) across SIM, SIM-NPC, and real-vehicle (FIELD).
Background
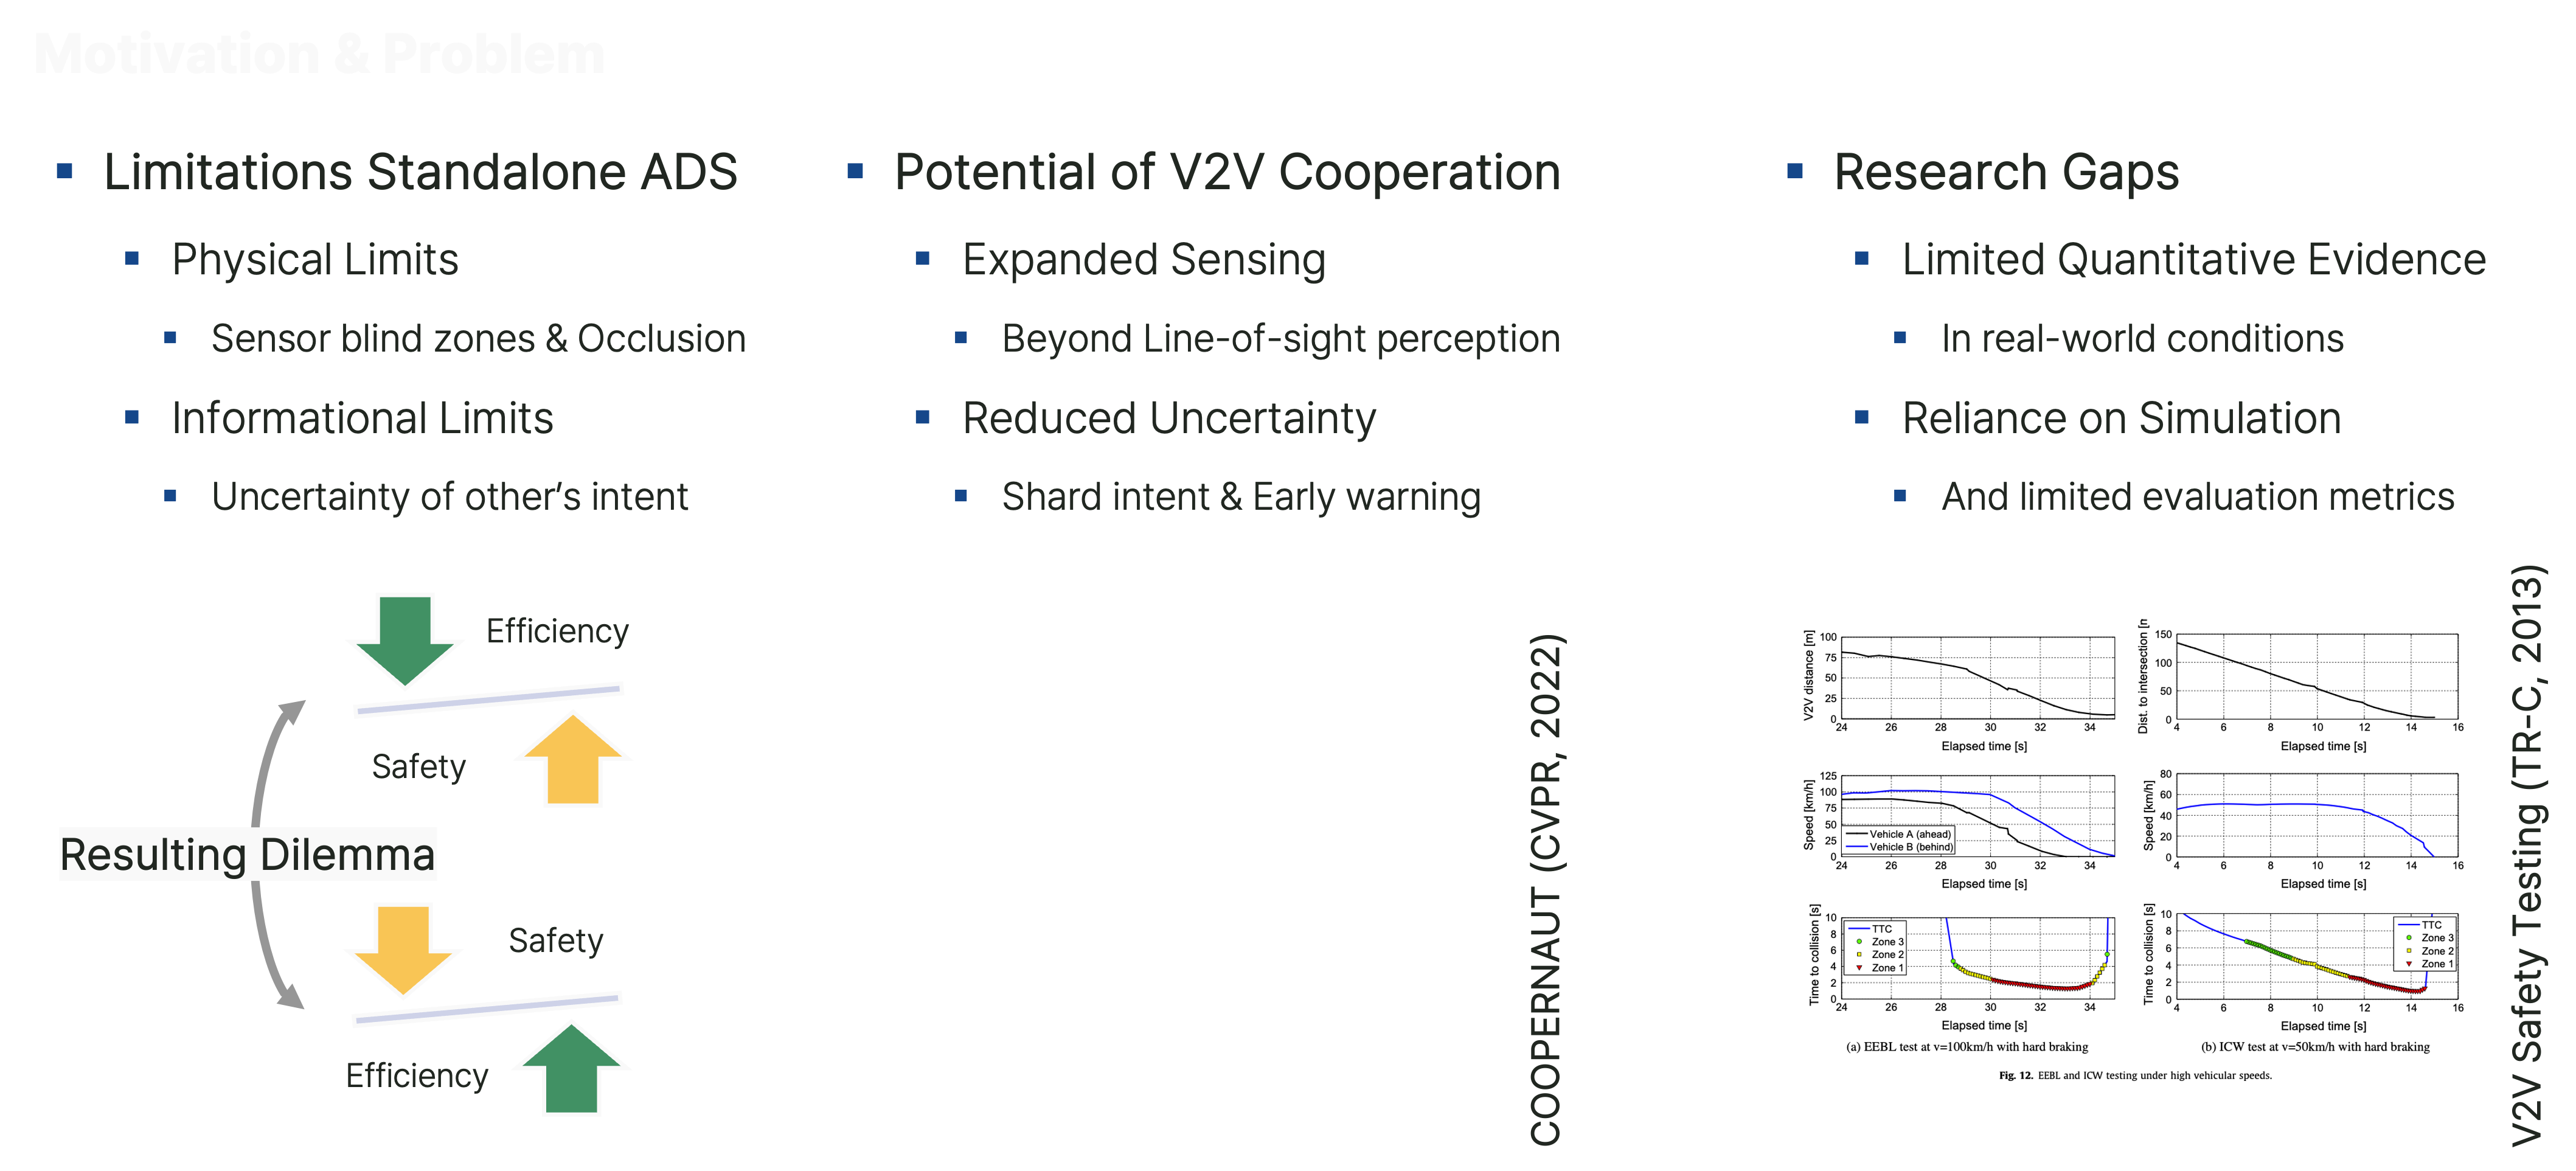
Standalone ADS suffers physical limits (sensor blind zones, occlusion) and informational limits (uncertainty about others’ intent). V2V cooperation promises expanded sensing and reduced uncertainty, but real-world quantitative evidence was scarce and work leaned on simulation.
Approach 1
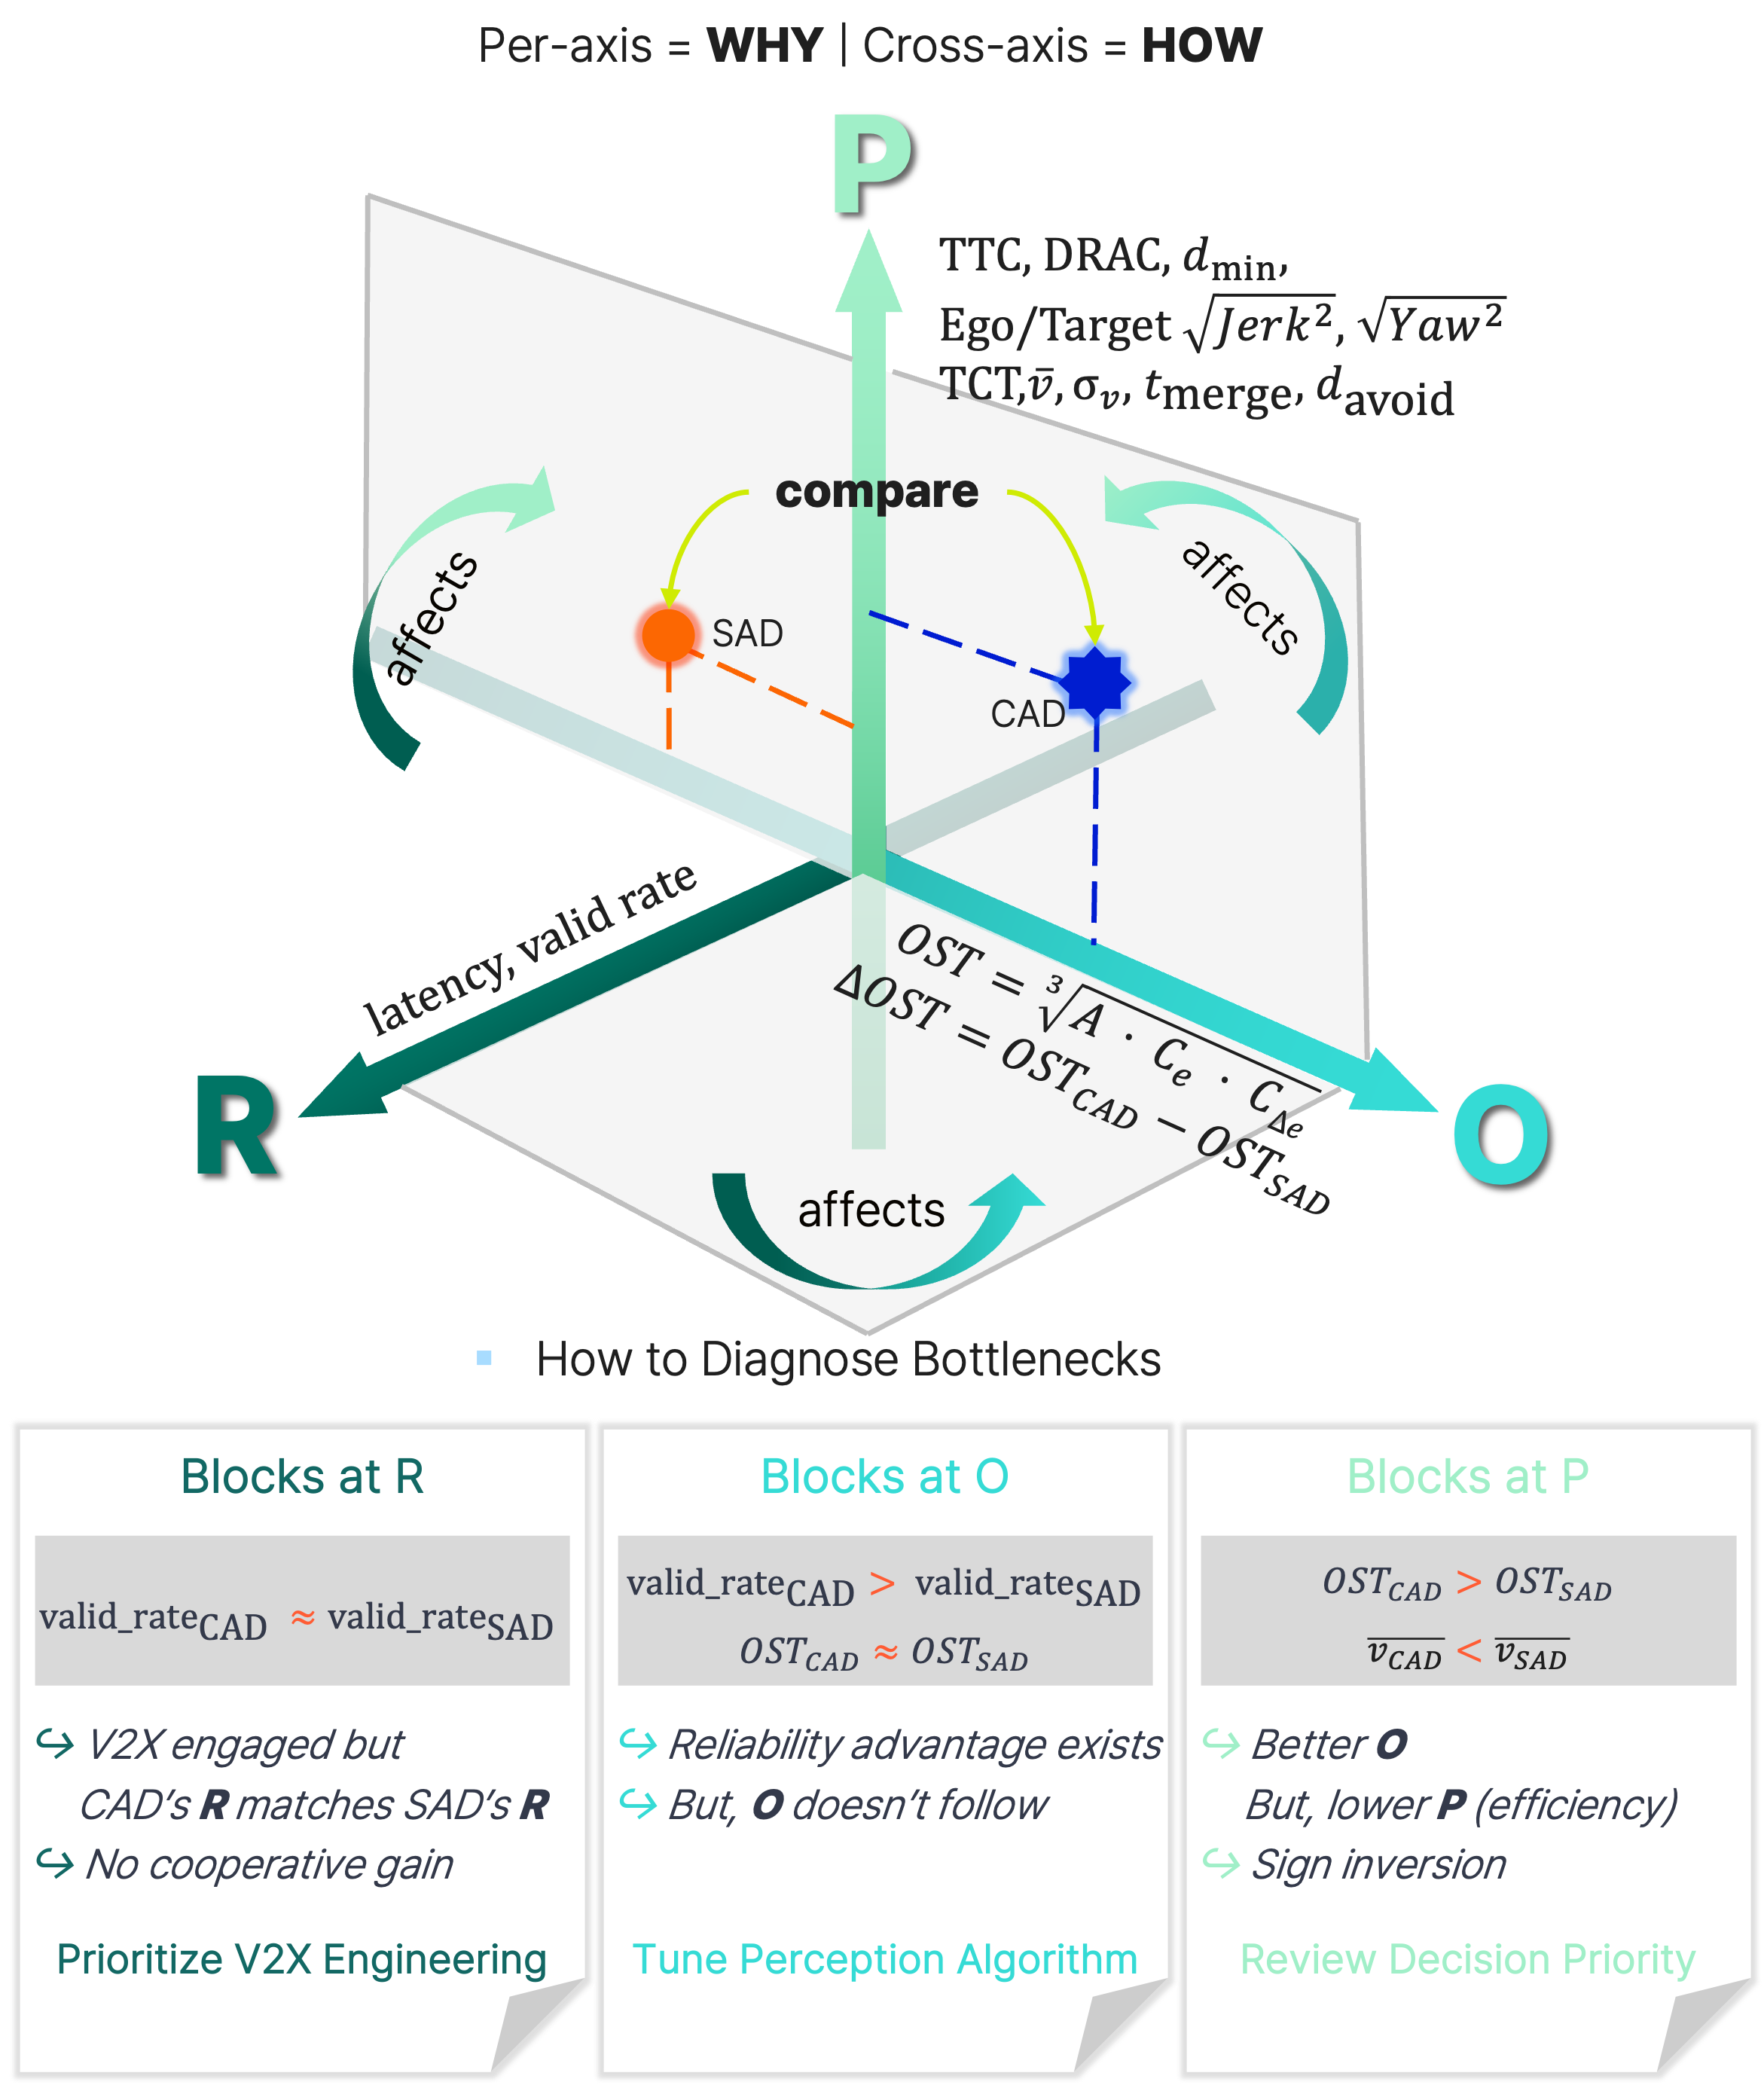
An R·O·P 3-axis framework — linking input reliability (R), perception state-estimation quality (O), and driving performance (P) — uses ΔOST to diagnose which axis is the bottleneck (R → V2X engineering, O → perception, P → decision priority).
Approach 2
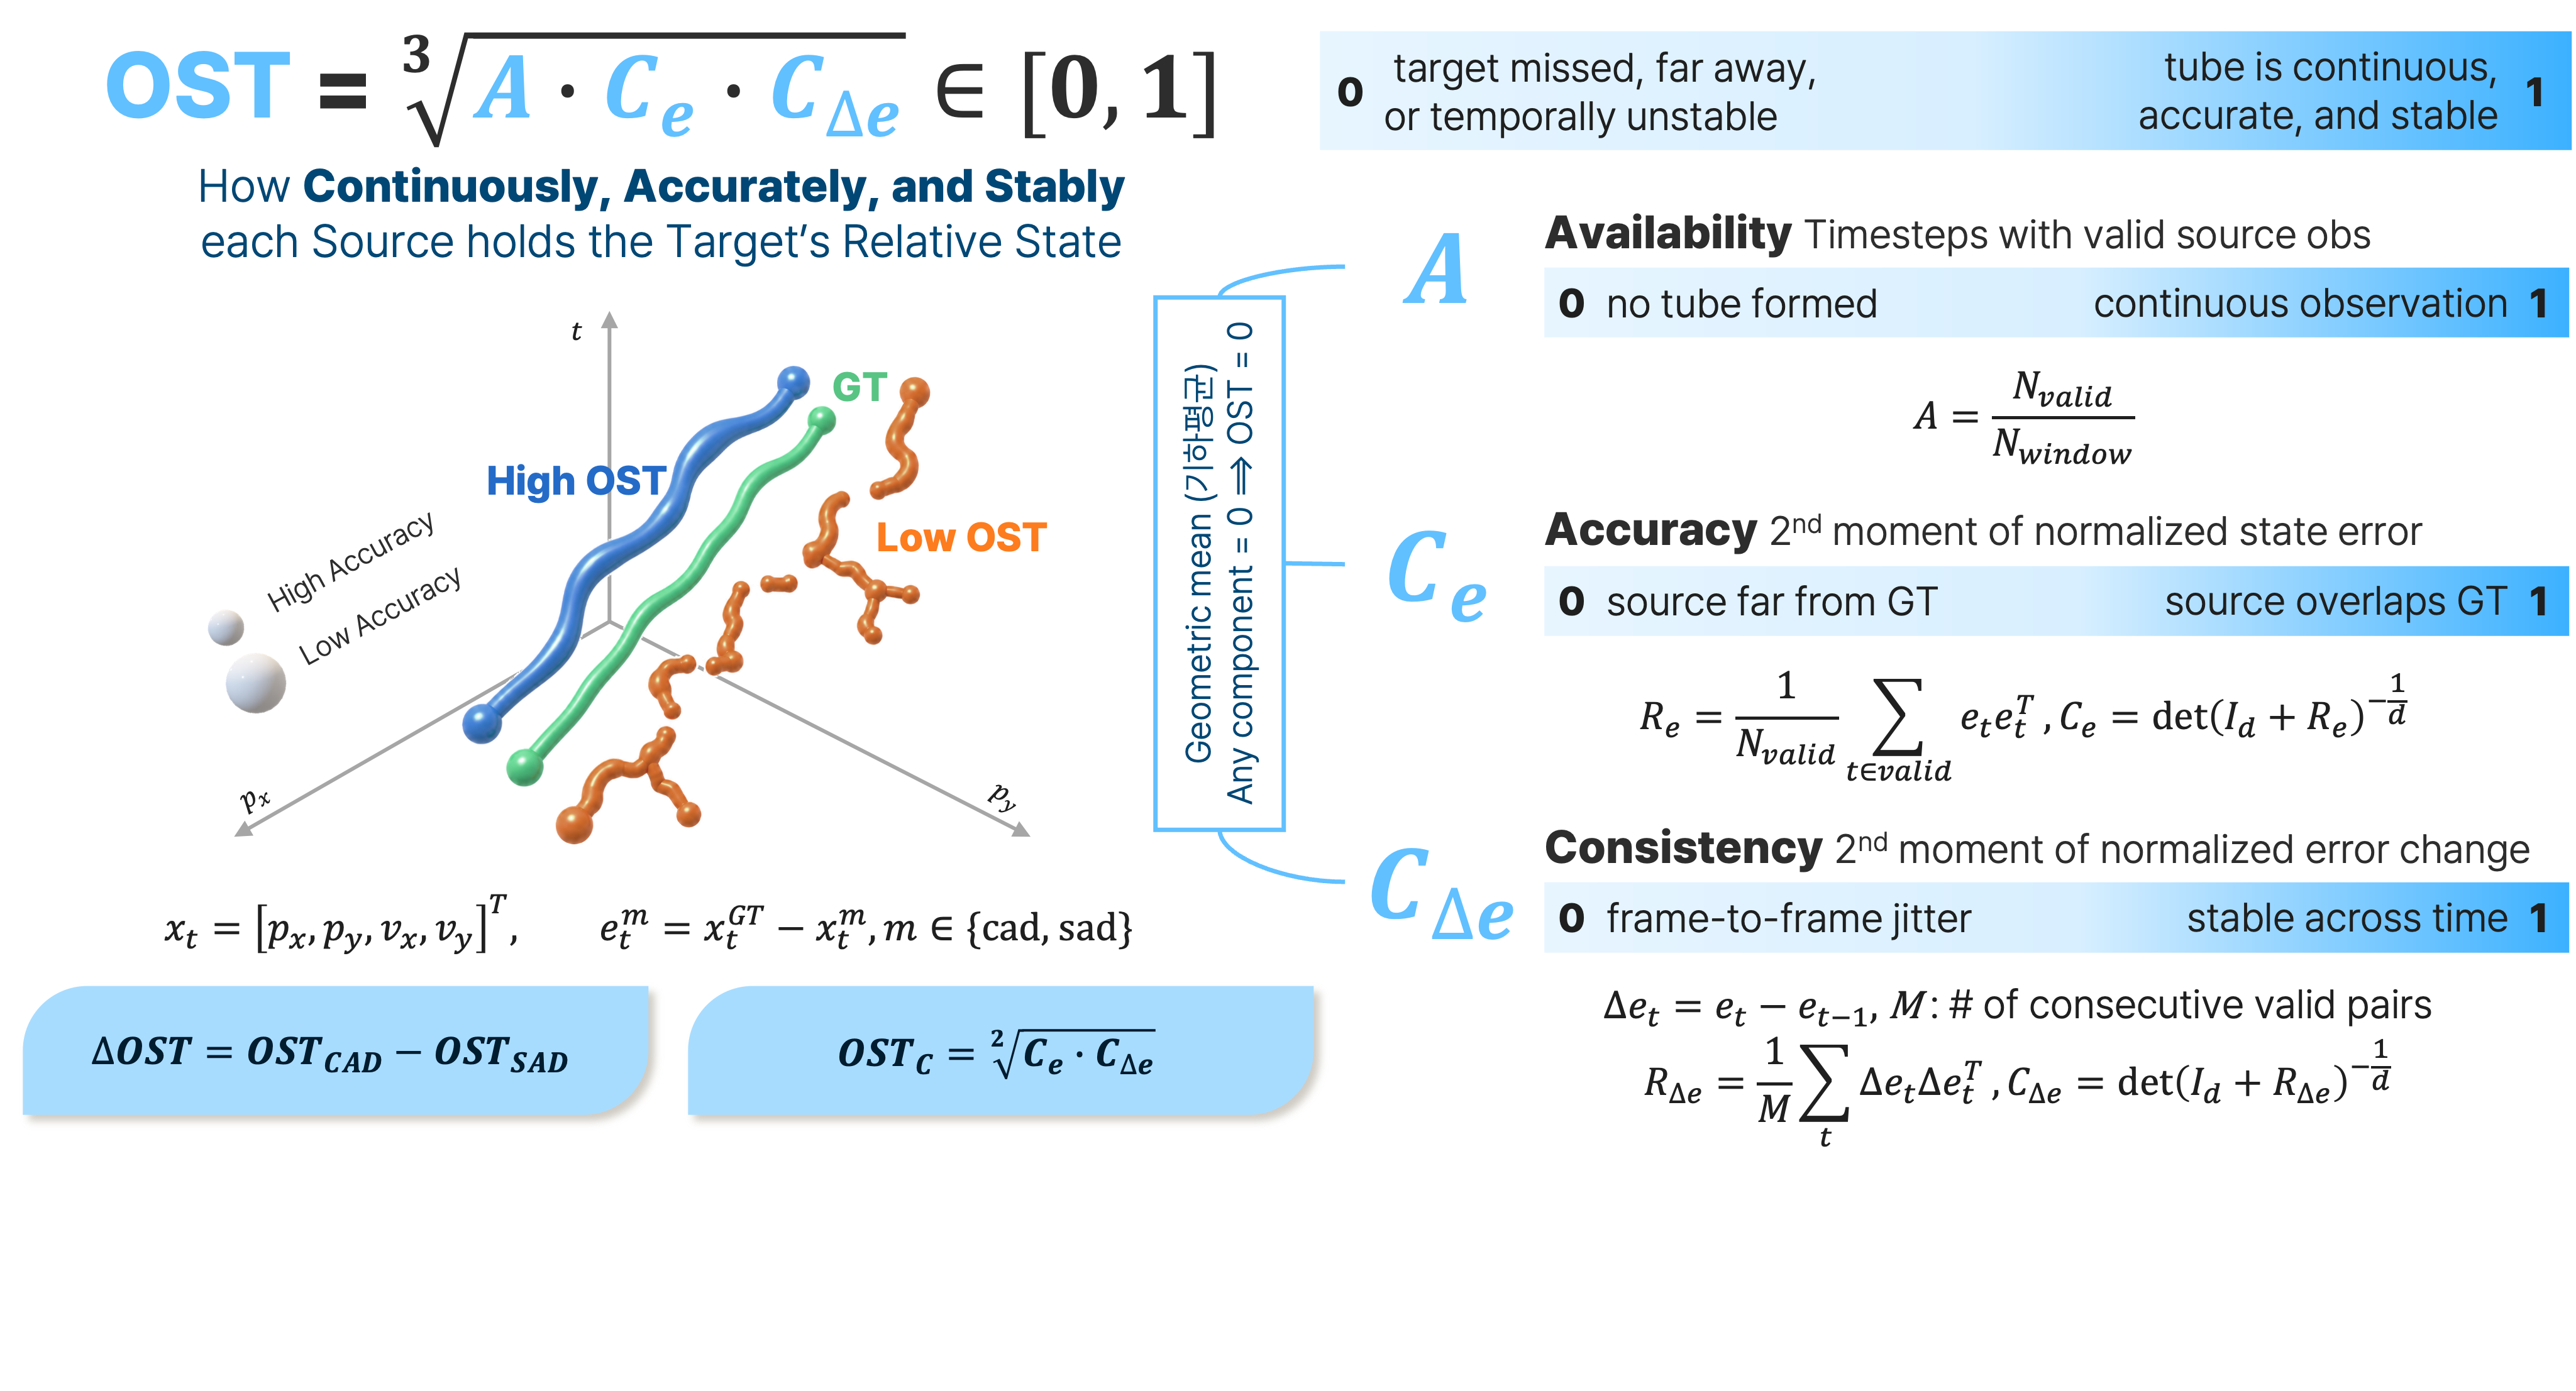
The OST metric — quantifies, in [0,1], how continuously (Availability), accurately (Accuracy), and stably (Consistency) each source holds the target’s relative state, with ΔOST = cooperative (CAD) − standalone (SAD) measuring information gain.
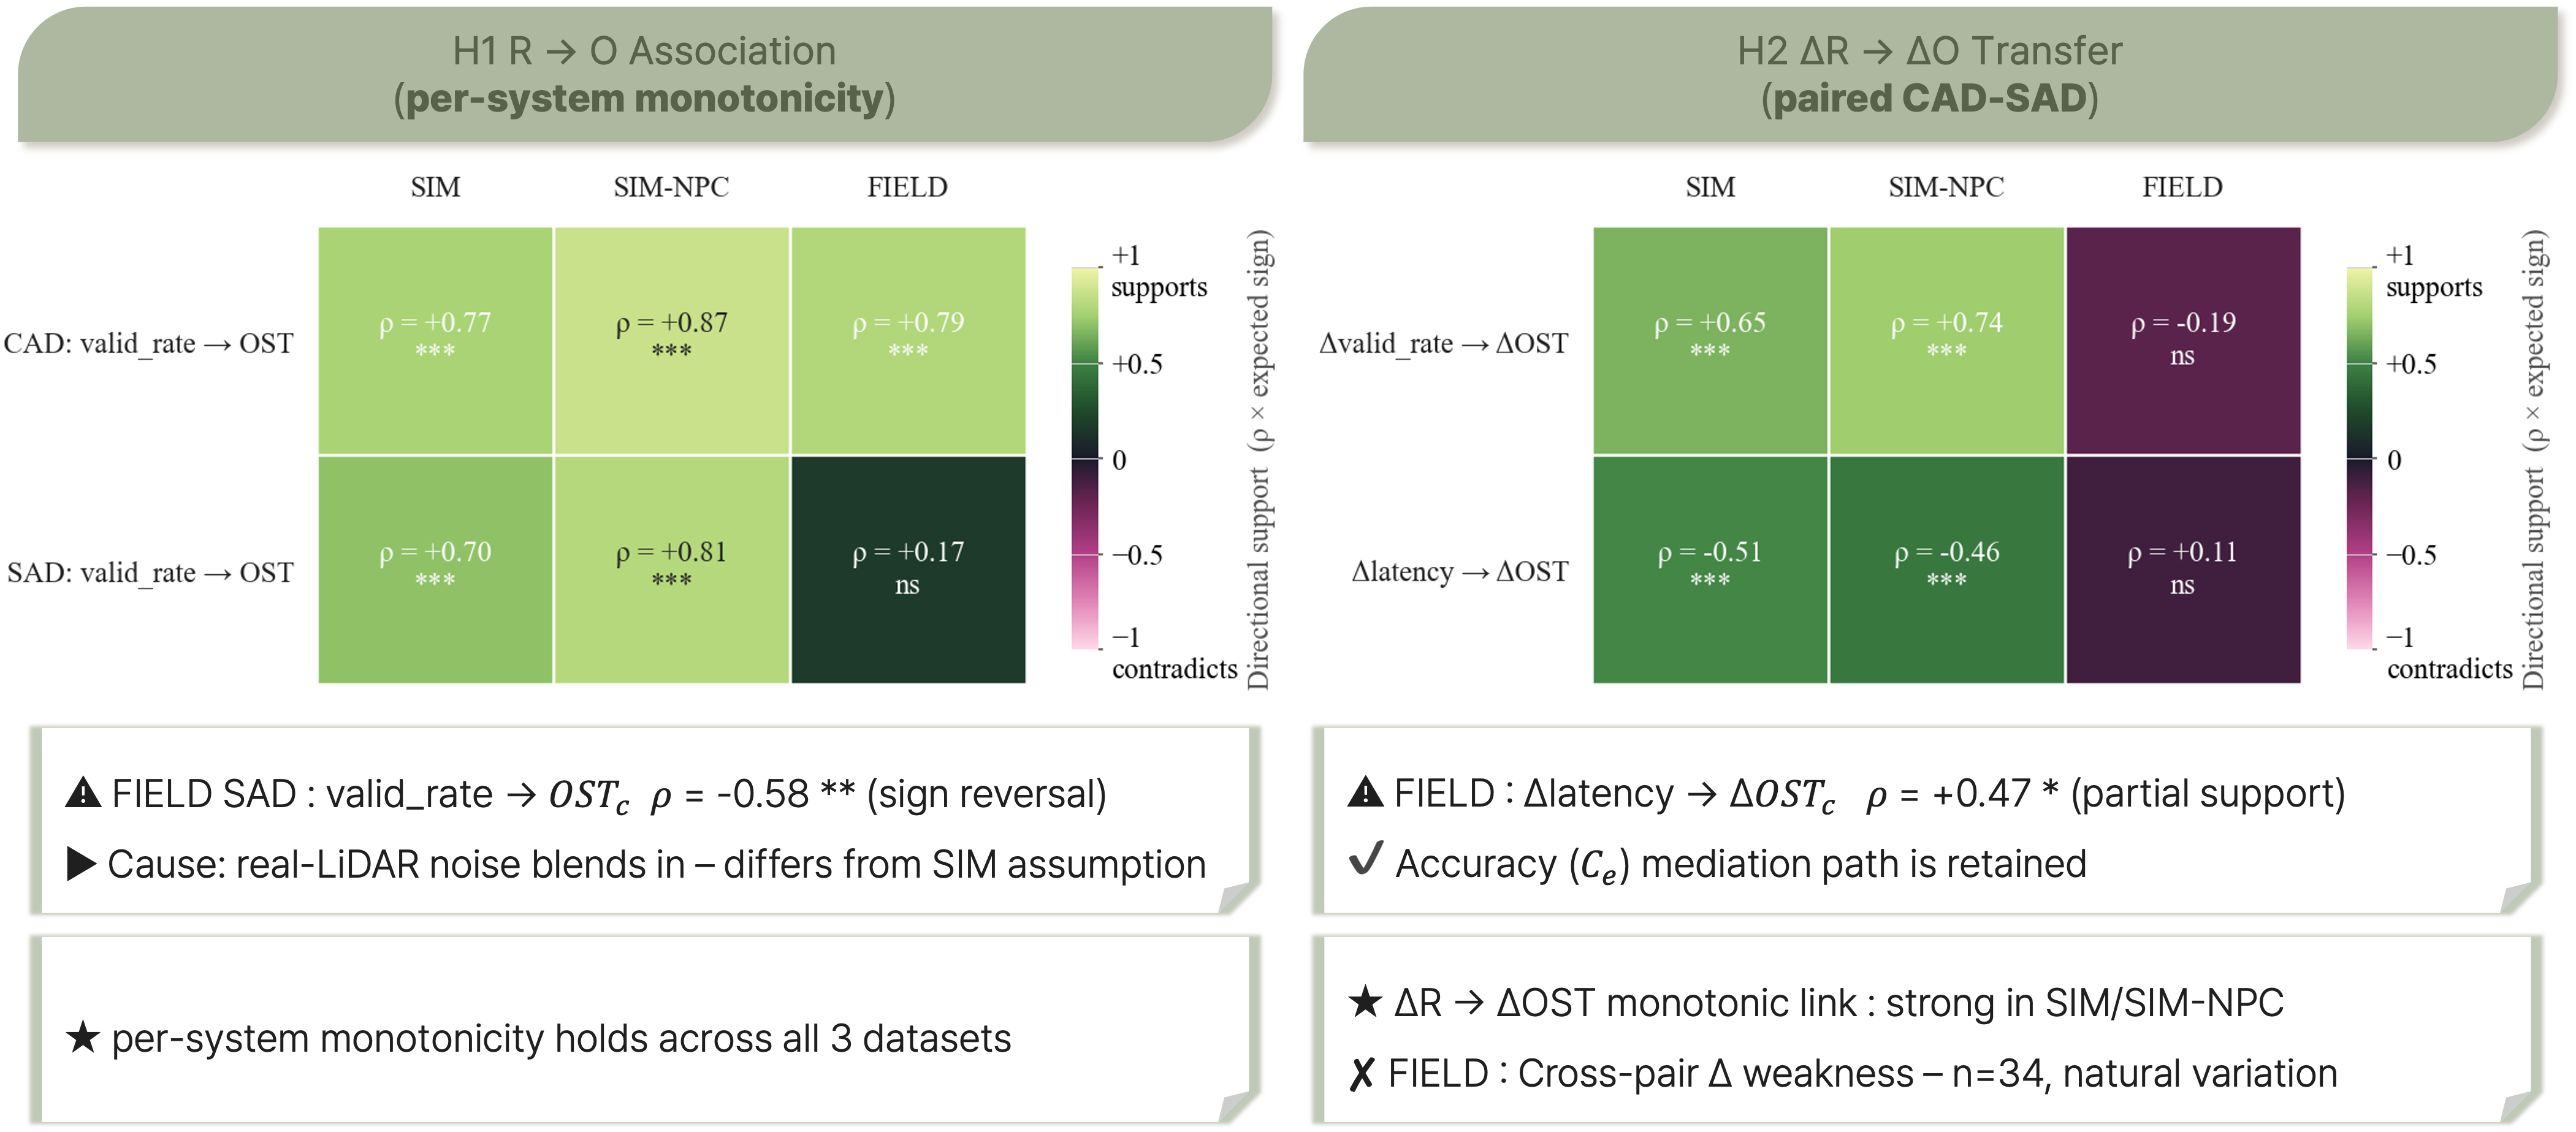
Result 1
Hypothesis testing — R→O association (H1) and ΔR→ΔO transfer (H2) analyzed by correlation across SIM, SIM-NPC, and real-vehicle (FIELD); per-system monotonicity held in all three.
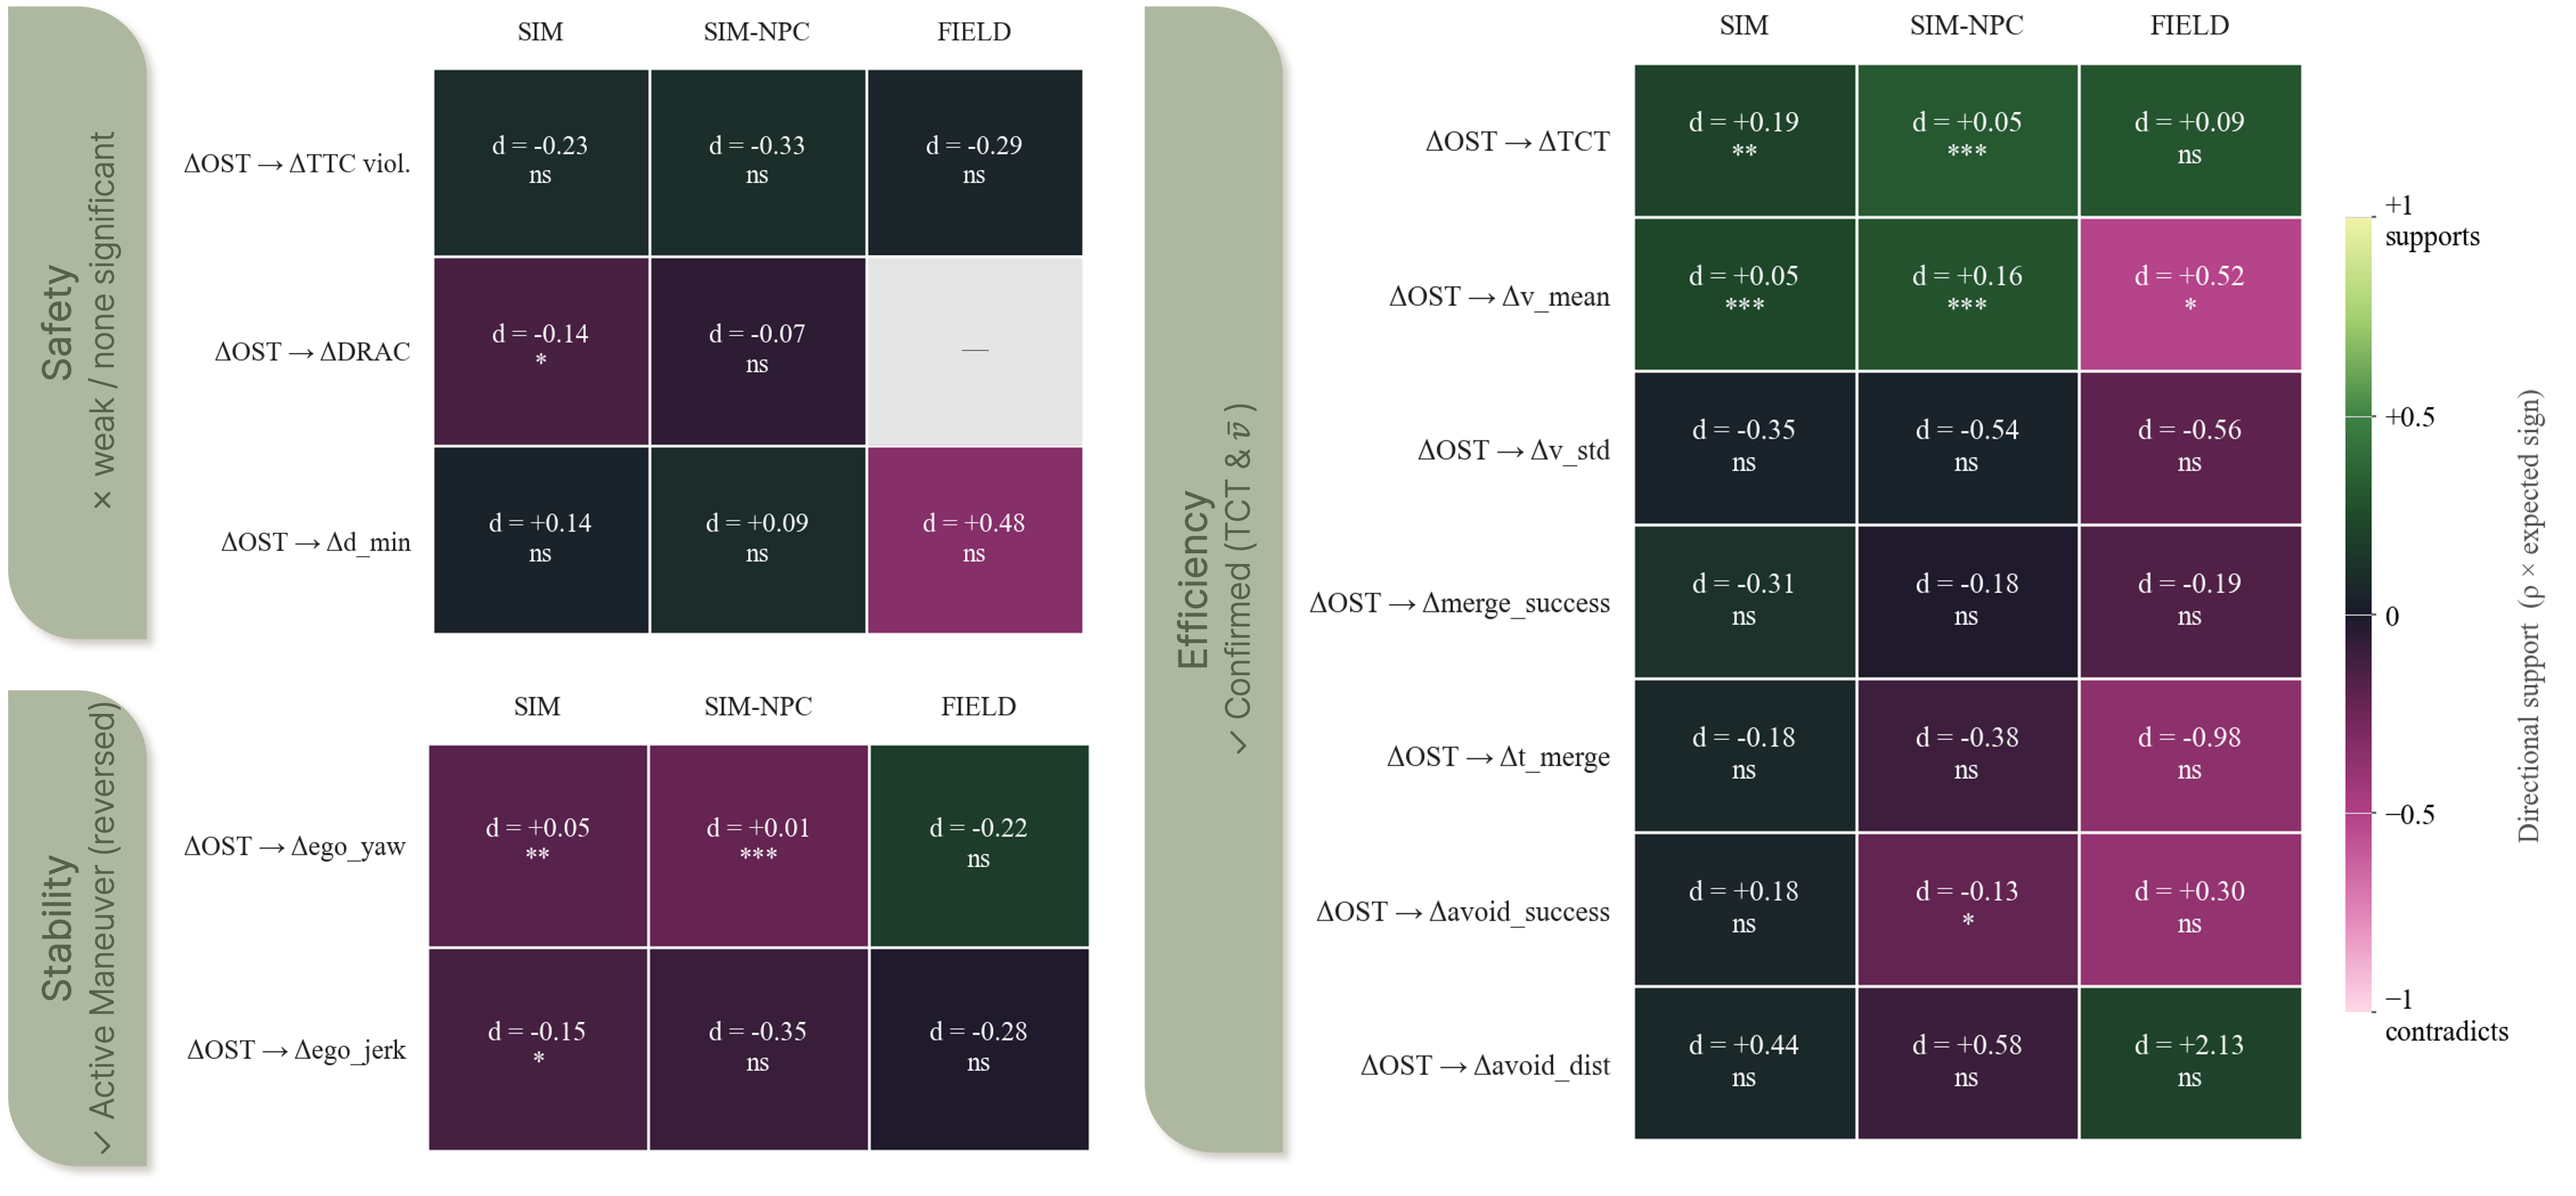
Result 2
Driving-outcome effects — effect sizes of ΔOST on safety, stability, and efficiency, with consistent gains confirmed in efficiency (merge/avoidance performance).